


 Thailand
 Mongolia
 Vietnam
 Tahiti


Page at www.fiba.basketball indicated:
Your suplied Email address (xxxxx@fiba.basketball) does not seem to be correct
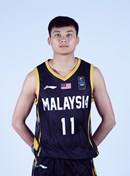
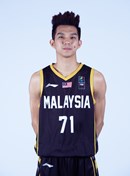
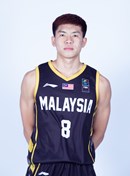
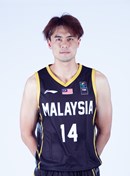
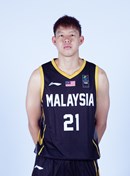
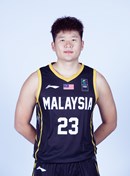
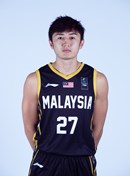
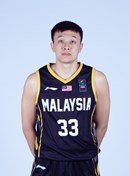
 Malaysia
Not Qualified Yet
The qualification process for the FIBA Asia Cup 2025 Qualifiers will consist of Two Rounds. The First round will qualify 12 teams to the Second Round from which the top 8 will advance to the FIBA Asia Cup 2025 Qualifiers.
Format »| Players | Games | Min | PTS | FG | 2PTS | 3PTS | FT | OREB | DREB | REB | AST | PF | TO | STL | BLK | +/- | Ef |
|---|---|---|---|---|---|---|---|---|---|---|---|---|---|---|---|---|---|
| C. Ting | 7 | 30.5 | 17.6 | 5.7/16.734.2% | 3.0/7.042.9% | 2.7/9.727.9% | 3.4/5.166.7% | 1.3 | 6.4 | 7.7 | 2.6 | 1.9 | 3.1 | 2.4 | 1.1 | 1.0 | 15.6 |
| Y. Wong | 7 | 25.2 | 20.4 | 6.6/14.445.5% | 5.0/9.652.2% | 1.6/4.932.4% | 5.7/9.162.5% | 1.3 | 5.0 | 6.3 | 1.4 | 1.3 | 3.6 | 0.7 | 0.0 | 1.6 | 14.0 |
| W. Ong | 7 | 22.8 | 2.1 | 1.0/2.935% | 0.9/2.140% | 0.1/0.720% | 0.0/0.30% | 0.7 | 3.6 | 4.3 | 3.1 | 2.6 | 2.1 | 2.4 | 0.3 | 1.3 | 8.0 |
| T. Kuek | 7 | 20.1 | 5.9 | 2.1/5.737.5% | 1.9/2.768.4% | 0.3/3.09.5% | 1.3/2.452.9% | 1.3 | 3.6 | 4.9 | 1.7 | 3.0 | 1.4 | 0.7 | 0.9 | -0.7 | 7.9 |
| W. Liew | 7 | 19.5 | 1.6 | 0.4/1.137.5% | 0.4/1.042.9% | 0.0/0.10% | 0.7/1.162.5% | 0.9 | 3.7 | 4.6 | 1.4 | 3.1 | 1.1 | 0.4 | 0.7 | 3.4 | 6.4 |
| X. Ooi | 7 | 15.4 | 7.3 | 2.4/7.034.7% | 0.9/1.946.2% | 1.6/5.130.6% | 0.9/1.175% | 0.3 | 2.6 | 2.9 | 1.1 | 0.9 | 1.4 | 0.1 | 0.4 | 3.0 | 5.6 |
| L. Mak | 7 | 15.2 | 2.0 | 0.9/3.326.1% | 0.6/2.721.1% | 0.3/0.650% | 0.0/0.30% | 1.0 | 2.7 | 3.7 | 1.1 | 1.4 | 0.9 | 0.3 | 0.4 | -2.1 | 4.0 |
| Y. Heng | 7 | 14.6 | 5.0 | 1.7/5.730% | 0.7/2.331.2% | 1.0/3.429.2% | 0.6/1.930.8% | 0.7 | 1.3 | 2.0 | 2.3 | 1.1 | 3.1 | 1.9 | 0.0 | -0.6 | 2.7 |
| W. Liew | 7 | 14.3 | 3.0 | 1.3/2.650% | 1.3/2.650% | 0.0/0.0-% | 0.4/1.725% | 1.0 | 2.6 | 3.6 | 1.9 | 0.7 | 0.4 | 0.6 | 0.0 | -1.9 | 6.0 |
| Z. Tem | 4 | 10.1 | 6.3 | 1.8/4.836.8% | 0.5/0.866.7% | 1.2/4.031.2% | 1.5/1.885.7% | 0.0 | 1.0 | 1.0 | 1.0 | 1.0 | 0.5 | 0.0 | 0.0 | -6.0 | 4.5 |
| W. Lim | 4 | 5.0 | 1.5 | 0.5/3.514.3% | 0.0/1.20% | 0.5/2.222.2% | 0.0/0.0-% | 0.8 | 0.8 | 1.5 | 0.0 | 0.0 | 1.0 | 0.0 | 0.0 | -7.8 | -1.0 |
| J. Hiew | 4 | 3.8 | 1.5 | 0.5/1.050% | 0.0/0.50% | 0.5/0.5100% | 0.0/0.20% | 0.3 | 0.5 | 0.8 | 0.0 | 0.3 | 1.0 | 0.3 | 0.0 | -3.3 | 0.8 |
| W. De | 3 | 15.8 | 7.3 | 3.0/8.336% | 2.3/5.343.8% | 0.7/3.022.2% | 0.7/0.7100% | 1.0 | 1.3 | 2.3 | 1.3 | 1.7 | 0.7 | 1.0 | 0.0 | -3.0 | 6.0 |
| K. Wong | 2 | 10.5 | 1.5 | 0.5/2.025% | 0.0/1.00% | 0.5/1.050% | 0.0/0.0-% | 0.0 | 2.0 | 2.0 | 0.0 | 0.5 | 0.0 | 0.5 | 0.0 | -4.0 | 2.5 |
| C. Lim | 2 | 6.8 | 1.0 | 0.5/2.520% | 0.5/2.025% | 0.0/0.50% | 0.0/0.0-% | 0.0 | 1.5 | 1.5 | 0.5 | 0.5 | 1.5 | 1.5 | 0.0 | -5.0 | 1.0 |
| Team/Coaches | 4.1 | 1.6 | 5.7 | 0.0 | 0.1 | 0.3 | 0.0 | 0.0 | 0.0 | 0.0 | |||||||
| TOTALS | 200.0 | 74.0 | 25.3/69.636.3% | 16.0/36.443.9% | 9.3/33.128% | 14.1/24.657.6% | 13.6 | 35.9 | 49.4 | 18.0 | 17.9 | 19.7 | 10.7 | 3.9 | -1.7 | 76.1 | |
| Players | Games | Min | PTS | FG | 2PTS | 3PTS | FT | OREB | DREB | REB | AST | PF | TO | STL | BLK | +/- | Ef |
|---|---|---|---|---|---|---|---|---|---|---|---|---|---|---|---|---|---|
| C. Ting | 7 | 213 | 123 | 40/11734.2% | 21/4942.9% | 19/6827.9% | 24/3666.7% | 9 | 45 | 54 | 18 | 13 | 22 | 17 | 8 | 7 | 109 |
| Y. Wong | 7 | 176 | 143 | 46/10145.5% | 35/6752.2% | 11/3432.4% | 40/6462.5% | 9 | 35 | 44 | 10 | 9 | 25 | 5 | 0 | 11 | 98 |
| W. Ong | 7 | 160 | 15 | 7/2035% | 6/1540% | 1/520% | 0/20% | 5 | 25 | 30 | 22 | 18 | 15 | 17 | 2 | 9 | 56 |
| T. Kuek | 7 | 141 | 41 | 15/4037.5% | 13/1968.4% | 2/219.5% | 9/1752.9% | 9 | 25 | 34 | 12 | 21 | 10 | 5 | 6 | -5 | 55 |
| W. Liew | 7 | 136 | 11 | 3/837.5% | 3/742.9% | 0/10% | 5/862.5% | 6 | 26 | 32 | 10 | 22 | 8 | 3 | 5 | 24 | 45 |
| X. Ooi | 7 | 108 | 51 | 17/4934.7% | 6/1346.2% | 11/3630.6% | 6/875% | 2 | 18 | 20 | 8 | 6 | 10 | 1 | 3 | 21 | 39 |
| L. Mak | 7 | 106 | 14 | 6/2326.1% | 4/1921.1% | 2/450% | 0/20% | 7 | 19 | 26 | 8 | 10 | 6 | 2 | 3 | -15 | 28 |
| Y. Heng | 7 | 102 | 35 | 12/4030% | 5/1631.2% | 7/2429.2% | 4/1330.8% | 5 | 9 | 14 | 16 | 8 | 22 | 13 | 0 | -4 | 19 |
| W. Liew | 7 | 100 | 21 | 9/1850% | 9/1850% | 0/0-% | 3/1225% | 7 | 18 | 25 | 13 | 5 | 3 | 4 | 0 | -13 | 42 |
| Z. Tem | 4 | 40 | 25 | 7/1936.8% | 2/366.7% | 5/1631.2% | 6/785.7% | 0 | 4 | 4 | 4 | 4 | 2 | 0 | 0 | -24 | 18 |
| W. Lim | 4 | 20 | 6 | 2/1414.3% | 0/50% | 2/922.2% | 0/0-% | 3 | 3 | 6 | 0 | 0 | 4 | 0 | 0 | -31 | -4 |
| J. Hiew | 4 | 15 | 6 | 2/450% | 0/20% | 2/2100% | 0/10% | 1 | 2 | 3 | 0 | 1 | 4 | 1 | 0 | -13 | 3 |
| W. De | 3 | 47 | 22 | 9/2536% | 7/1643.8% | 2/922.2% | 2/2100% | 3 | 4 | 7 | 4 | 5 | 2 | 3 | 0 | -9 | 18 |
| K. Wong | 2 | 21 | 3 | 1/425% | 0/20% | 1/250% | 0/0-% | 0 | 4 | 4 | 0 | 1 | 0 | 1 | 0 | -8 | 5 |
| C. Lim | 2 | 14 | 2 | 1/520% | 1/425% | 0/10% | 0/0-% | 0 | 3 | 3 | 1 | 1 | 3 | 3 | 0 | -10 | 2 |
| Team/Coaches | 29 | 11 | 40 | 0 | 1 | 2 | 0 | 0 | 0 | 0.0 | |||||||
| TOTALS | 1400 | 518 | 177/48736.3% | 112/25543.9% | 65/23228% | 99/17257.6% | 95 | 251 | 346 | 126 | 125 | 138 | 75 | 27 | -12 | 533.0 | |


")


Copyright FIBA All rights reserved. No portion of FIBA.basketball may be duplicated, redistributed or manipulated in any form.
By accessing FIBA.basketball pages, you agree to abide by FIBA.basketball terms and conditions.